

Texas plants have to tell the state within 24 hours whenever an unauthorized release of air pollution goes over a reportable amount. The state publishes every one of those emission event reports, more than 100,000 since 2003. Plants that hold large amounts of dangerous chemicals also report their serious accidents to the EPA. Put the two together and you can test an idea that process safety has relied on for decades: that small releases pile up before a big accident. We wrote the test down and registered it before comparing a single accident with the events. Across 545 serious accidents at 216 Texas plants, we found no sign that they do.
Two public records, one test
The Texas Commission on Environmental Quality (TCEQ) keeps every report in its Air Emission Event Report Database. When we downloaded every page in October 2026, it held 103,614 reports, 71,027 of them unplanned emission events. The EPA's Risk Management Program (RMP) covers plants that hold more than a set amount of certain toxic or flammable chemicals. Each one lists its serious accidents: releases that caused deaths, injuries or significant property damage on site, or injuries, evacuations, sheltering in place or damage off site.
The two databases use different ID numbers, so we linked them plant by plant, using EPA's own facility registry and a hand review that never showed any event or accident counts. That gave 1,140 linked plants. Before opening any accident data, we also checked that the reports record real releases. On nights when a plant reported flaring, the odds that a satellite detected heat at the site were 6.6 times higher than on its other nights, and downwind air monitors recorded sulfur dioxide at 1.9 times its usual level during reported events.
The test compares each plant with itself. For every accident, it counts the plant's unplanned events in the three months before, stopping one week short of the accident, and compares that count with the same count on the plant's other days in the same year. Comparing a plant with itself, within one year, takes its size, its equipment and its reporting habits out of the picture. The question, the window, the model and 30 robustness checks were all registered on OSF before any accident was compared with any event.
No sign that the small stuff rises first
As registered, doubling a plant's recent events went with 0.88 times the accident risk (95% interval 0.75 to 1.02). That is not a rise. It turned out to be pulled down by a problem explained in the next section, and with that fixed the estimate is 1.05 (0.85 to 1.29). Rises larger than about 30% per doubling are therefore unlikely. Smaller ones cannot be ruled out.
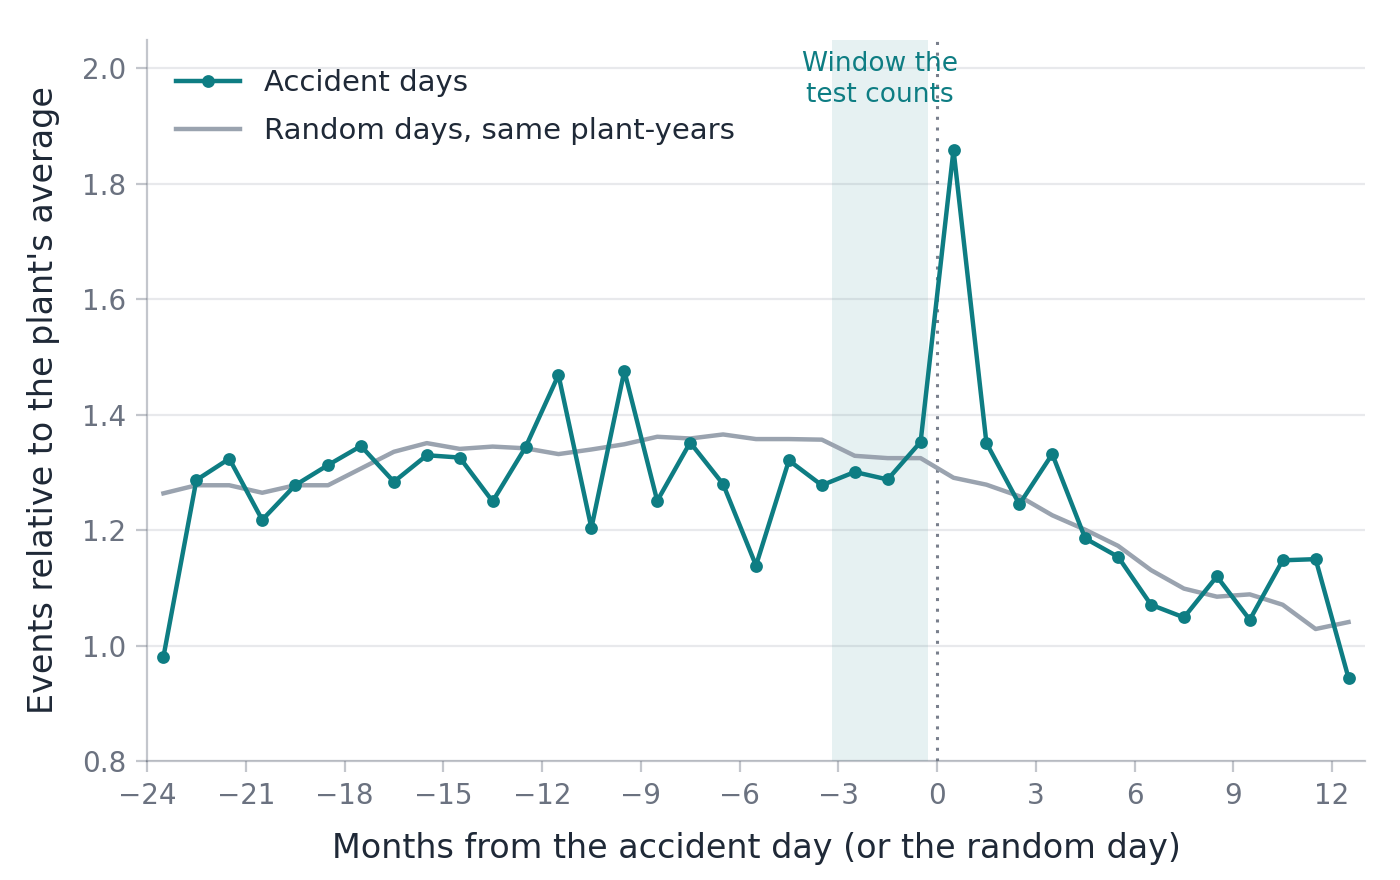
A picture says the same without any model. In each month before an accident, the plant's events run at about the level seen around random days in the same years. The only jump is in the month that starts on the accident day, and the one-week gap keeps it out of the test.
Accidents report themselves
The registered estimate came out slightly below 1, as if more events meant fewer accidents. They don't. On the 541 days with an RMP accident at a linked plant, the plants filed 212 unplanned event reports, against 9.7 expected from their usual rates: about 22 times as many. A fire or a large release is itself an emission event, so this is no surprise, but it changes what the test measures.
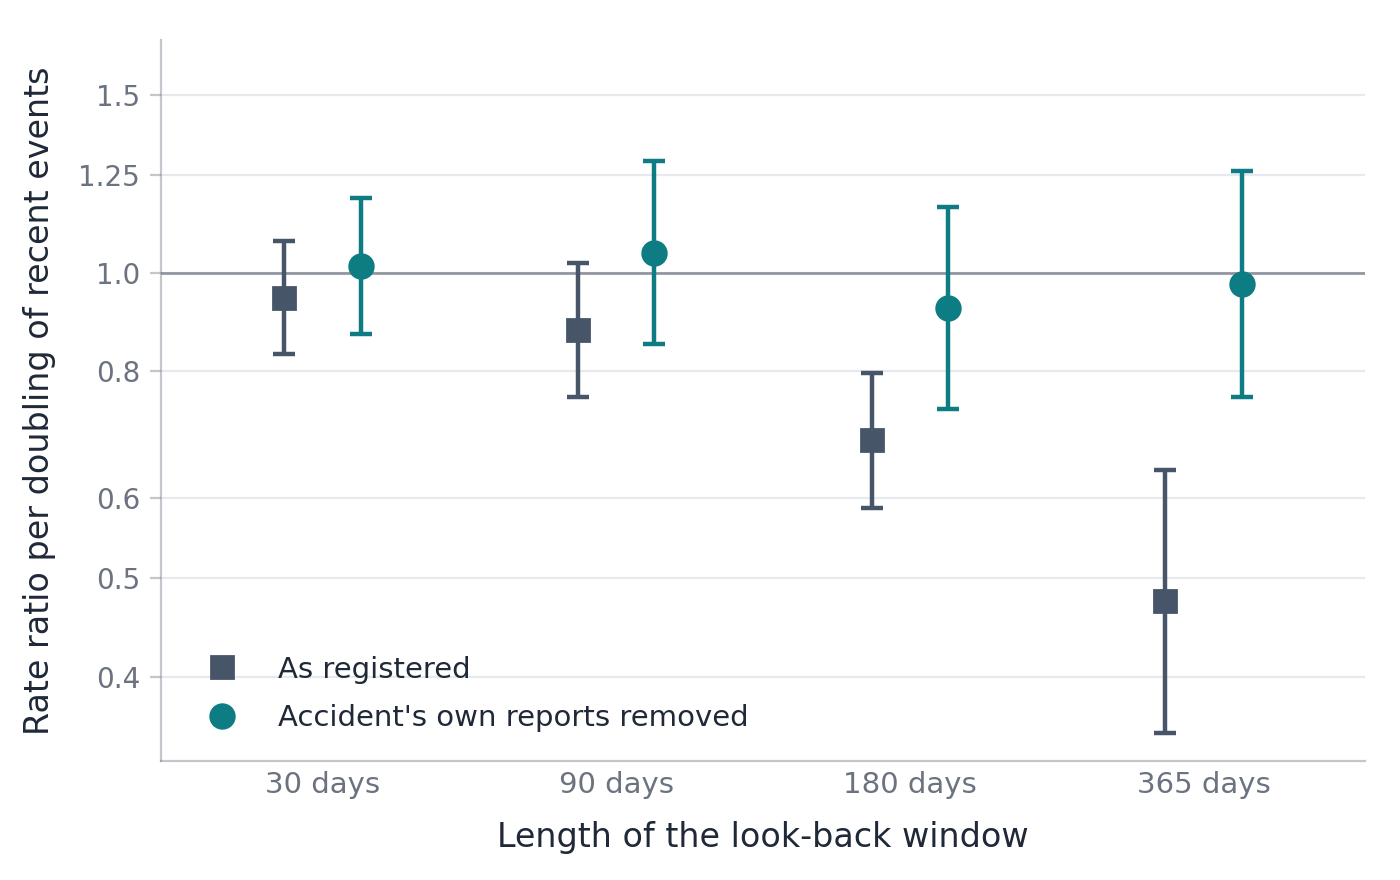
Say a plant has an accident on March 1 and files three event reports that day. With a 90-day window and a one-week gap, those three reports count toward every day from March 9 to June 6. Those are comparison days in the same year, with more recent events and no accident, so the model reads them as a sign that more events go with less risk. The longer the window, the more days the reports reach, and the further the estimate falls: 0.95 for a 30-day window, 0.88 for 90 days, 0.68 for 180 and 0.47 for 365.
The fix is to remove each plant's own reports from the accident day and the two days after, 0.8% of the events, while keeping every day in the comparison. With that, every window comes out close to 1. In a simulation built on the real event counts, where simulated accidents filed reports at the same rate as real ones, the trap hid a real 30% rise almost completely, and the fix recovered it. We found the trap after the registered result was in, so the paper reports the registered number next to the corrected one in every table.
Anyone who tests reported incidents as warning signs of accidents that also get reported can fall into the same trap. The check is simple: before reading the result, count the indicator reports that land on and just after the accident days.
Every other way of looking agrees
One database can mislead, so we checked the answer against other records. Serious incidents reported to the National Response Center, which are mostly different events at mostly the same plants, give the same answer. So do deaths and severe injuries reported to OSHA, and events that release a chemical the plant handles in its RMP processes. Every count so far is reported by the company itself, so we also counted the nights a satellite detected heat at the plant. That shows no clear rise either.
| Check | As registered | Own reports removed |
|---|---|---|
| RMP accidents, the main test (545 accidents, 216 plants) | 0.88 (0.75 to 1.02) | 1.05 (0.85 to 1.29) |
| National Response Center serious reports (218 days, 105 sites) | 0.82 (0.66 to 1.01) | 1.08 (0.88 to 1.33) |
| OSHA deaths and severe injuries, from 2015 (210 days, 81 plants) | 1.10 (0.79 to 1.54) | 1.13 (0.80 to 1.60) |
| Only events that release the plant's own RMP chemicals | 0.91 (0.77 to 1.07) | 1.06 (0.84 to 1.34) |
| Nights with satellite heat detected at the plant, 2012 to 2021 | 1.09 (0.90 to 1.32) | 1.13 (0.93 to 1.38) |
The plan also required the test to be run over all 1,152 combinations of its main choices: where the window ends, the gap, the window length, the event types counted, the plant links and the rule for duplicate accidents. Window length drives almost all of the variation, as the trap predicts. Only 10 of the 1,152 versions are significantly above 1, all in one narrow corner, and that corner led to the lead described below. As a final check, this plant's events should not predict accidents at other plants in the same county and sector, and they don't (1.00).
Over years, hints of a link
The picture changes a little over longer spans. Across a plant's whole history, its busier periods have modestly more accidents (1.24 per doubling, an exploratory estimate), and plants with more events one year have slightly more accidents the next (1.12, 0.99 to 1.26). But a plant's past accidents and its size predict accidents far better, and adding events barely improves a forecast of which plants will have one in a given quarter. A simple flag for any reported event in the past 90 days catches 42% of the quarters with an accident, but for every quarter it flags correctly, 38 flagged quarters have none. Events say a little about where risk is, and nothing we could detect about when an accident is coming.
One lead worth a fresh test
Plants also report planned work: maintenance, startups and shutdowns that will release more than their permits allow. Counting those reports over the last week before an accident was not in the plan. The narrow corner of the 1,152 versions pointed to it, so it is a lead, not a finding. In the week after a plant reported planned work, accidents were about 1.6 times as likely (1.08 to 2.39). The estimate is highest after startups and lowest after routine maintenance, though those differences are uncertain, and it fits what process safety has long said about the risk of starting up and shutting down.
It rests on 32 accidents at 17 plants. A first further test, on National Response Center reports, was too small to settle it either way. And these reports have nearly stopped: at linked plants they fell from more than 1,000 a year before 2010 to 65 in 2025, so the lead will be hard to test on new Texas data.
What it means
For plant safety teams, a rising count of reported emission events is not a short-term alarm for a serious accident at the same plant. Each event is still a loss of containment, and investigating it can teach something whether or not the count predicts anything. For regulators, the one public record that pointed at days of higher risk was the notice of planned work, and those notices have nearly disappeared. It would be worth knowing why. For people who live near these plants, emission events matter for air quality and health on their own, and this study does not question that. It asks a narrower question: whether the count warns, in the weeks before, that a serious accident is coming.
What this shows and does not show
- It shows that counts of reported emission events did not rise in the three months before serious accidents at the same plants, up to a week before each accident. It does not show that events are harmless.
- It covers Texas plants in EPA's Risk Management Program that could be linked to TCEQ sites. RMP misses some serious events, but National Response Center records, mostly of different events at the same plants, give the same answer.
- Rises smaller than about 30% per doubling cannot be ruled out, and the last week before each accident is outside the main test.
- The correction for the accidents' own reports was added after the registered result was seen. A simulation supports it, and with no real effect it leans slightly toward finding a rise, not away from one.
- It is about warning, not cause. A link over many years can come from shared causes, such as aging equipment or the quality of management.
- No plant or company is named or ranked, here or in the paper.
Everything is public
The registered plan, the code behind every number, the linked tables, the hand-review answers and every result file are public. One command reruns the whole analysis from the tables, in about 10 hours on a four-core laptop, and every downloaded file is listed with its SHA-256 hash. The main estimate was computed by two separately written programs that agree to ten decimal places. A copy of every TCEQ report page as downloaded in October 2026 is archived with the paper on Zenodo. The tables identify sites by the public ID numbers that TCEQ and EPA assign, so anyone can check how the two databases were linked.
Questions
Do emission events warn of chemical accidents at Texas plants?
Not in the weeks before, on this evidence. Across 545 serious accidents at 216 Texas plants from 2003 to 2021, a plant's unplanned emission events in the three months before an accident, stopping a week before it, were no more frequent than at its other times in the same year. Doubling a plant's recent events changed its accident risk by a factor of 1.05 (95% interval 0.85 to 1.29), so rises larger than about 30% are unlikely. Smaller rises cannot be ruled out.
What is an emission event in Texas?
An unauthorized release of air pollution above a reportable quantity. A Texas plant must report one to the Texas Commission on Environmental Quality (TCEQ) within 24 hours of discovering it, and TCEQ publishes the reports in its Air Emission Event Report Database. When we downloaded it in October 2026 it held 103,614 reports filed since 2003, 71,027 of them unplanned emission events.
What is the EPA Risk Management Program?
A federal rule for plants that hold more than a set amount of certain toxic or flammable chemicals. Each covered plant files a risk management plan with a five-year accident history: every accidental release from a covered process that caused deaths, injuries or significant property damage on site, or known deaths, injuries, evacuations, sheltering in place, property damage or environmental damage off site. This study used the RMP database as released by the Data Liberation Project.
Why did the first result make emission events look protective?
Because accidents report themselves. On accident days, plants filed about 22 times their usual number of event reports. Those reports then count toward the look-back window of the comparison days that follow, which have more recent events and no accident, so more events seem to go with less risk. Removing each plant's own reports from the accident day and the two days after fixes this. In a simulation, the bias hid a real 30% rise and the fix recovered it.
Are accidents more likely after startups and shutdowns?
That is the one lead in the data. In the week after a plant reported planned maintenance, a startup or a shutdown to TCEQ, accidents were about 1.6 times as likely, with the highest estimate after startups. It was found after the main results were seen and rests on 32 accidents at 17 plants, and a first further test was too small to settle it, so it is a lead to be tested, not a finding.
Are the data and code available?
Yes. The registered plan is on OSF (osf.io/nf426). The code, the linked tables, the hand-review answers and every result file are on GitHub (github.com/OrygnsCode/emission-events-warning) and archived on Zenodo with the paper (doi.org/10.5281/zenodo.23348378), together with a copy of the TCEQ report pages as downloaded in October 2026. One command reruns the whole analysis.
Abstract
From the paper
Process safety standards treat small releases as leading indicators of serious accidents, but the link has rarely been tested with records kept outside the companies themselves. Texas publishes every report of an emission event, an unauthorized release of air pollution above a reportable quantity that a plant must report within 24 hours, and the U.S. Environmental Protection Agency's Risk Management Program (RMP) records serious chemical accidents at covered plants. We collected all 103,614 Texas event reports filed from 2003 to 2026, linked those from RMP plants to the same plants' accident records, and asked, in a preregistered test, whether a plant's unplanned emission events become more frequent in the three months before a serious accident, stopping one week before it. We found no sign that they do. Across 545 accidents at 216 plants from 2003 to 2021, comparing each accident day with the same plant's other days in the same year, the registered estimate was 0.88 times the accident risk per doubling of recent events (95% confidence interval 0.75 to 1.02). After seeing the registered result, we found that it is biased downward. An accident generates its own event reports, 22 times the plant's usual daily rate on the accident day, and those reports fall into the look-back counts of the comparison days that follow. Removing each plant's reports from the accident day and the two days after gives 1.05 (0.85 to 1.29). Rises larger than about 30% per doubling are therefore unlikely, though smaller ones cannot be excluded. In a simulation, the bias hid a real 30% rise and the correction recovered it. Serious incidents reported to the National Response Center, OSHA injury records, events that release the plant's own regulated chemicals, and satellite heat detections at the plant also show no clear rise. Over longer spans there are hints of a link. Across a plant's whole history, periods with more events have modestly more accidents (1.24 per doubling, an exploratory estimate), and between plants, more events in one year go with slightly more accidents the next (1.12, 0.99 to 1.26), although events add little to prediction beyond a plant's size and its past accidents. One exploratory lead, found after the main results were seen, is that accidents were about 1.6 times as likely in the week after a plant reported planned work, mainly startups and shutdowns. A first further test was inconclusive. The registered plan, the code and the derived data are public.